Data Analysis & Visualization
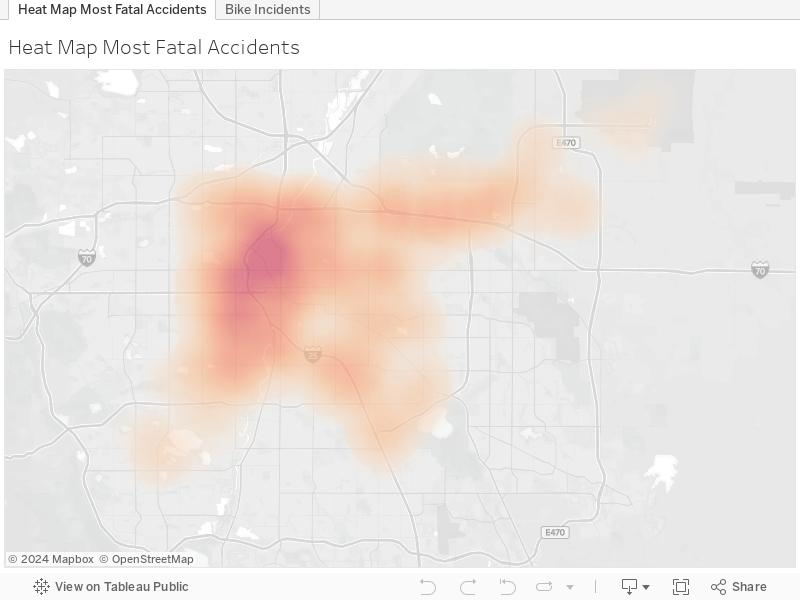
I analyzed several themes with the traffic accident data provided by Denvergov.org. The first component I wanted to explore was to better understand where the majority of the traffic accidents occur in Denver. I used a heat map to create a visual that shows the density/frequency of accidents in Denver. The heat map I created shows the biggest problem areas for accidents in Denver are in and around I-25 in downtown Denver.
Next, I wanted to look at trends in accidents involving cyclists. I created a bar chart with the given data set that shows the number of cyclists involved in accidents as well as color density to represent fatalities.
Data Biography
The data set represented here includes motor vehicle crashes reported to the Denver Police Department within the city and county of Denver. This data is publicly available on Denver’s website at denvergov.org and was collected by the Denver Police Department, specifically their Data Analysis Unit. The data is then maintained and provided by the City and County of Denver Technology Services and Denver GIS. The dataset is continuously updated with its last update on April 19, 2024. The Denver Police Department completes a State of Colorado Accident Report for incidents with significant damage, injuries, fatalities, or drug/alcohol involvement and the data includes incidents still under investigation. The purpose of this data set is to provide the public access to traffic information for safety and transparency. Urban planning and traffic management are some examples of groups that can use such data to better understand traffic patterns and other safety factors.